From Raw Telemetry
to Player Intelligence.
The premium command center for game server networks. Build custom dashboards, analyze campaigns, track connector health, and monitor real-time alerts in one unified platform.
Platform totals from the ShardAnalytics production network.
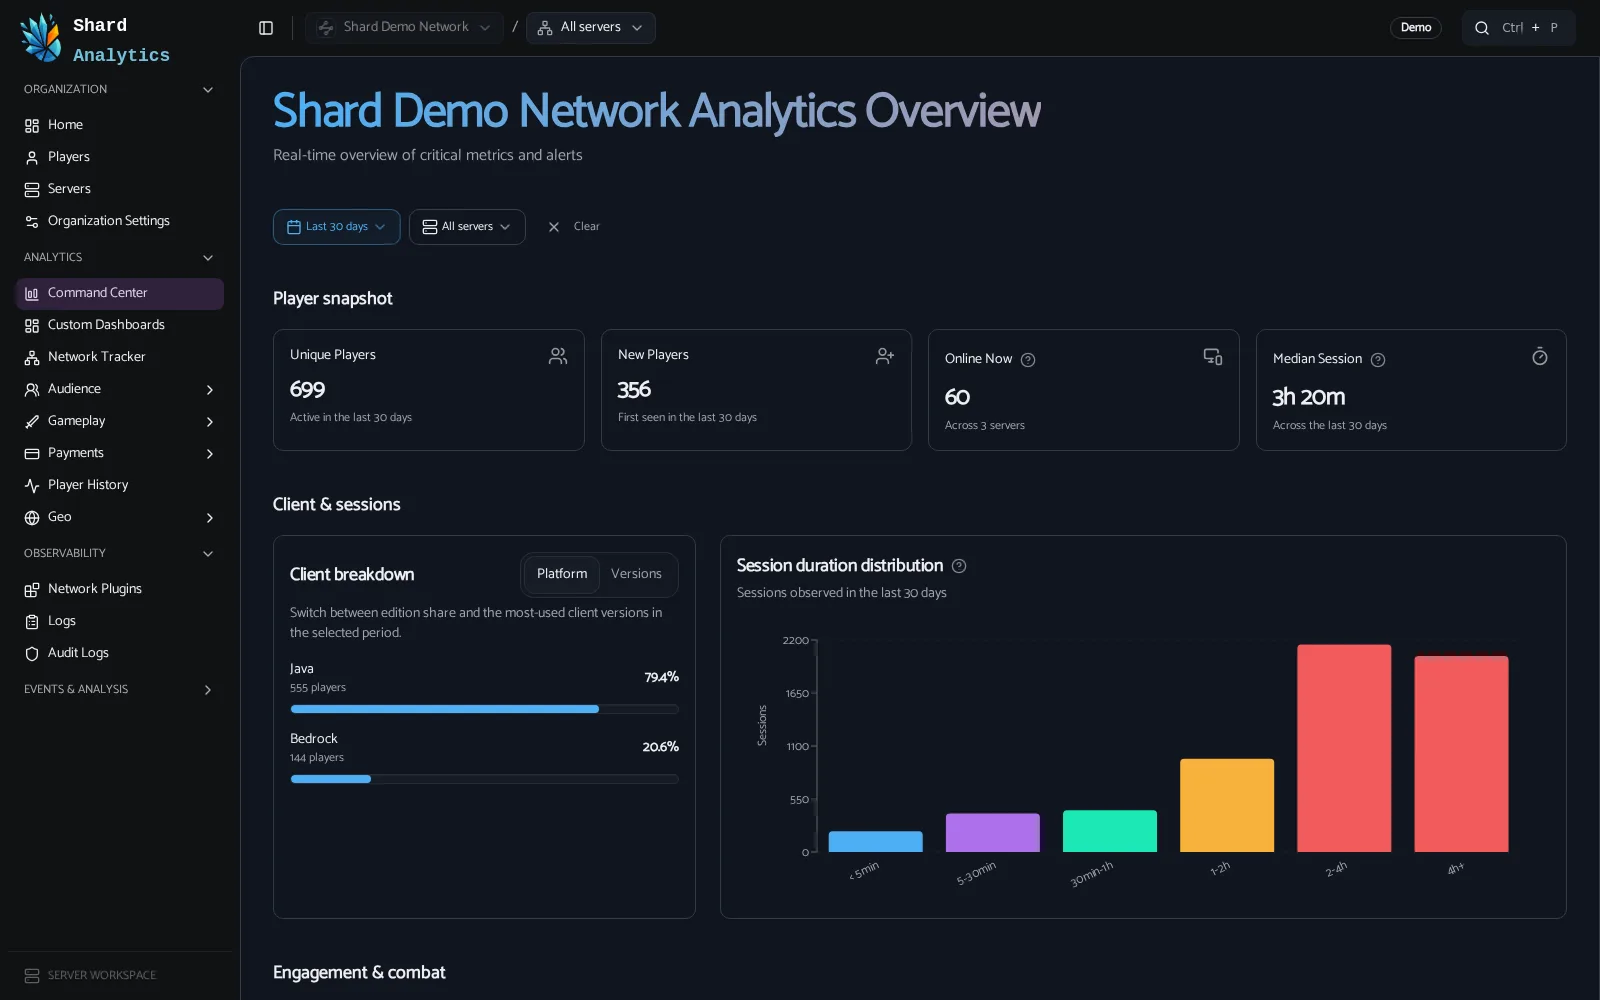
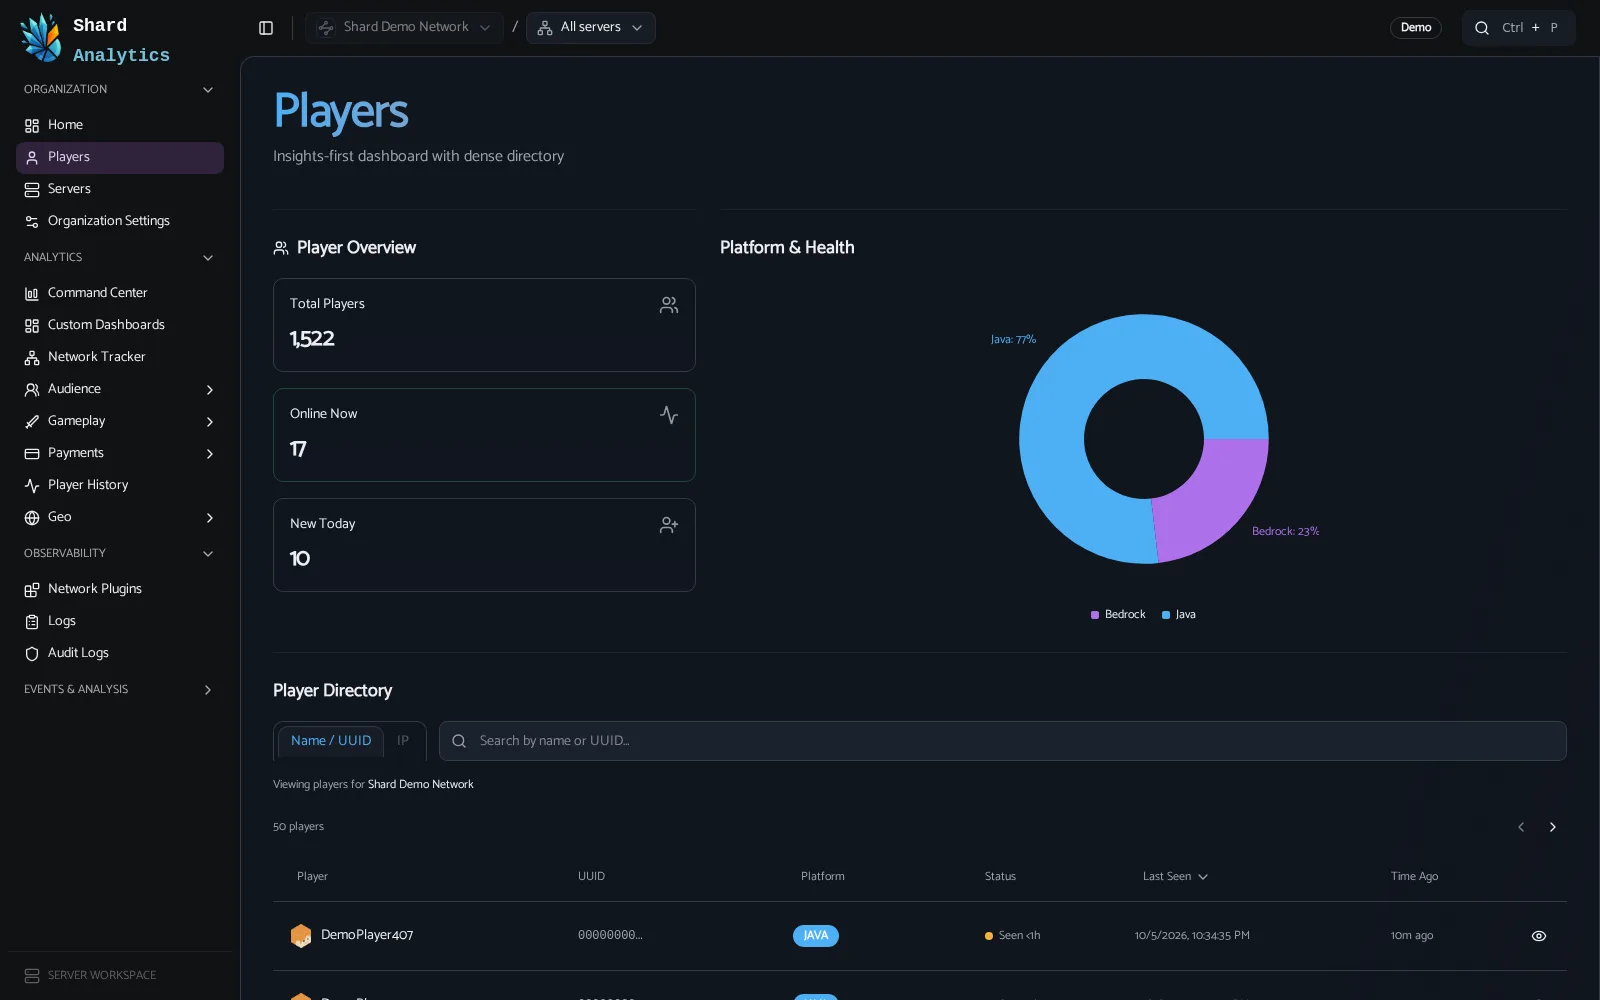
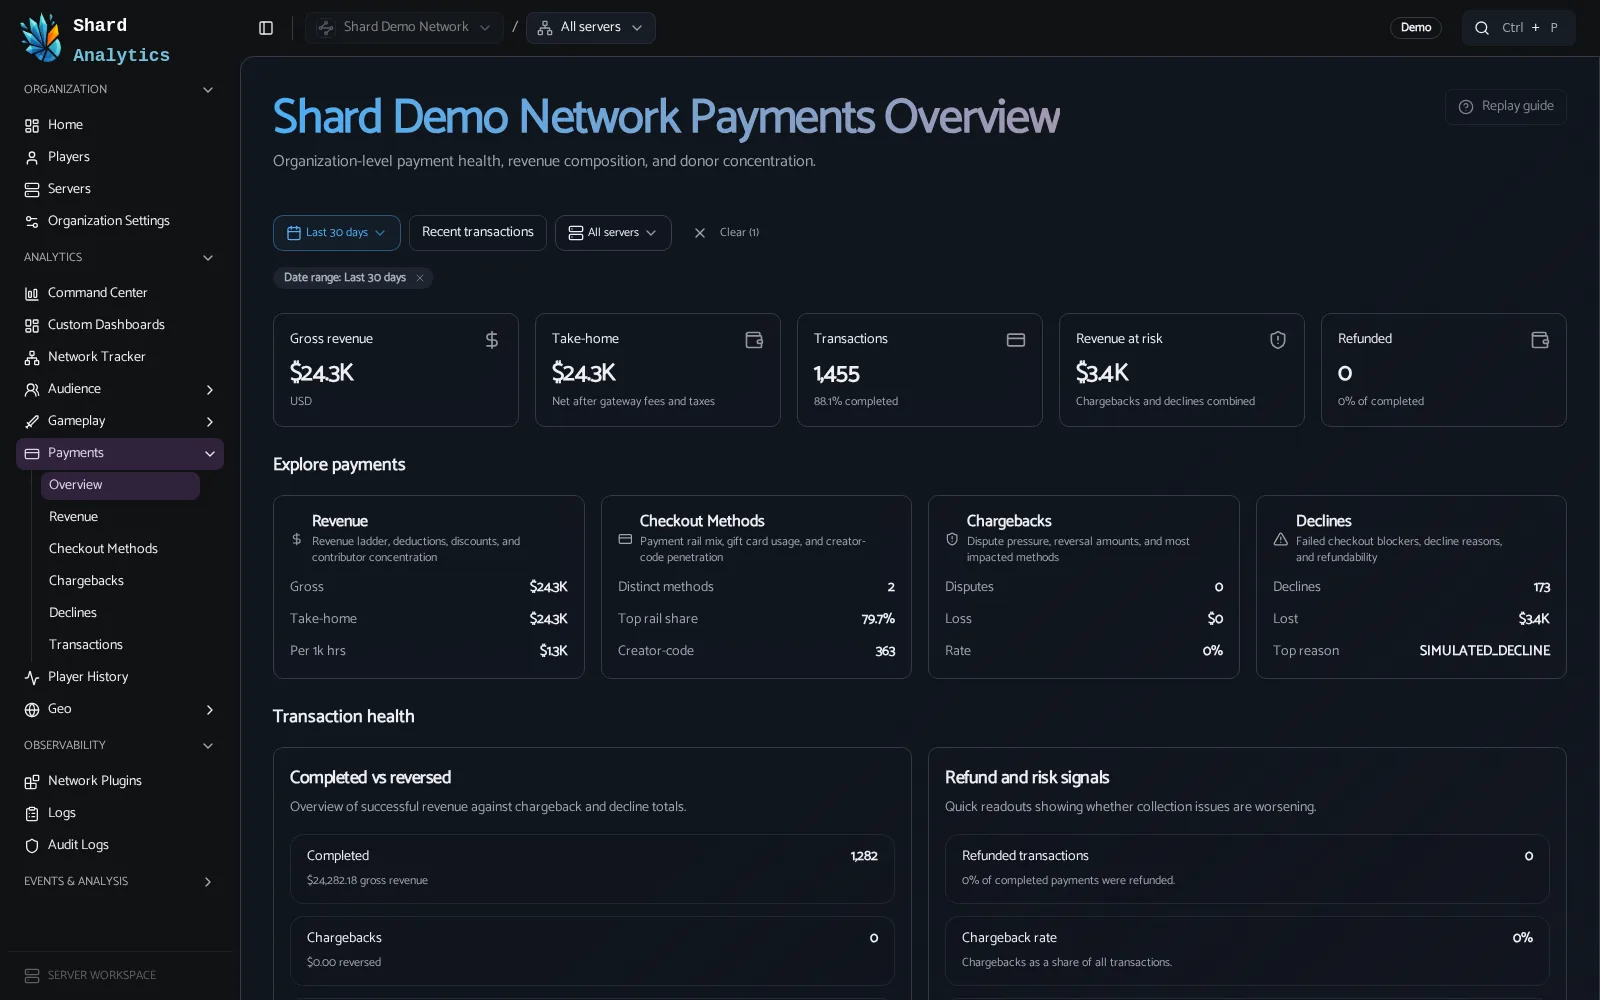
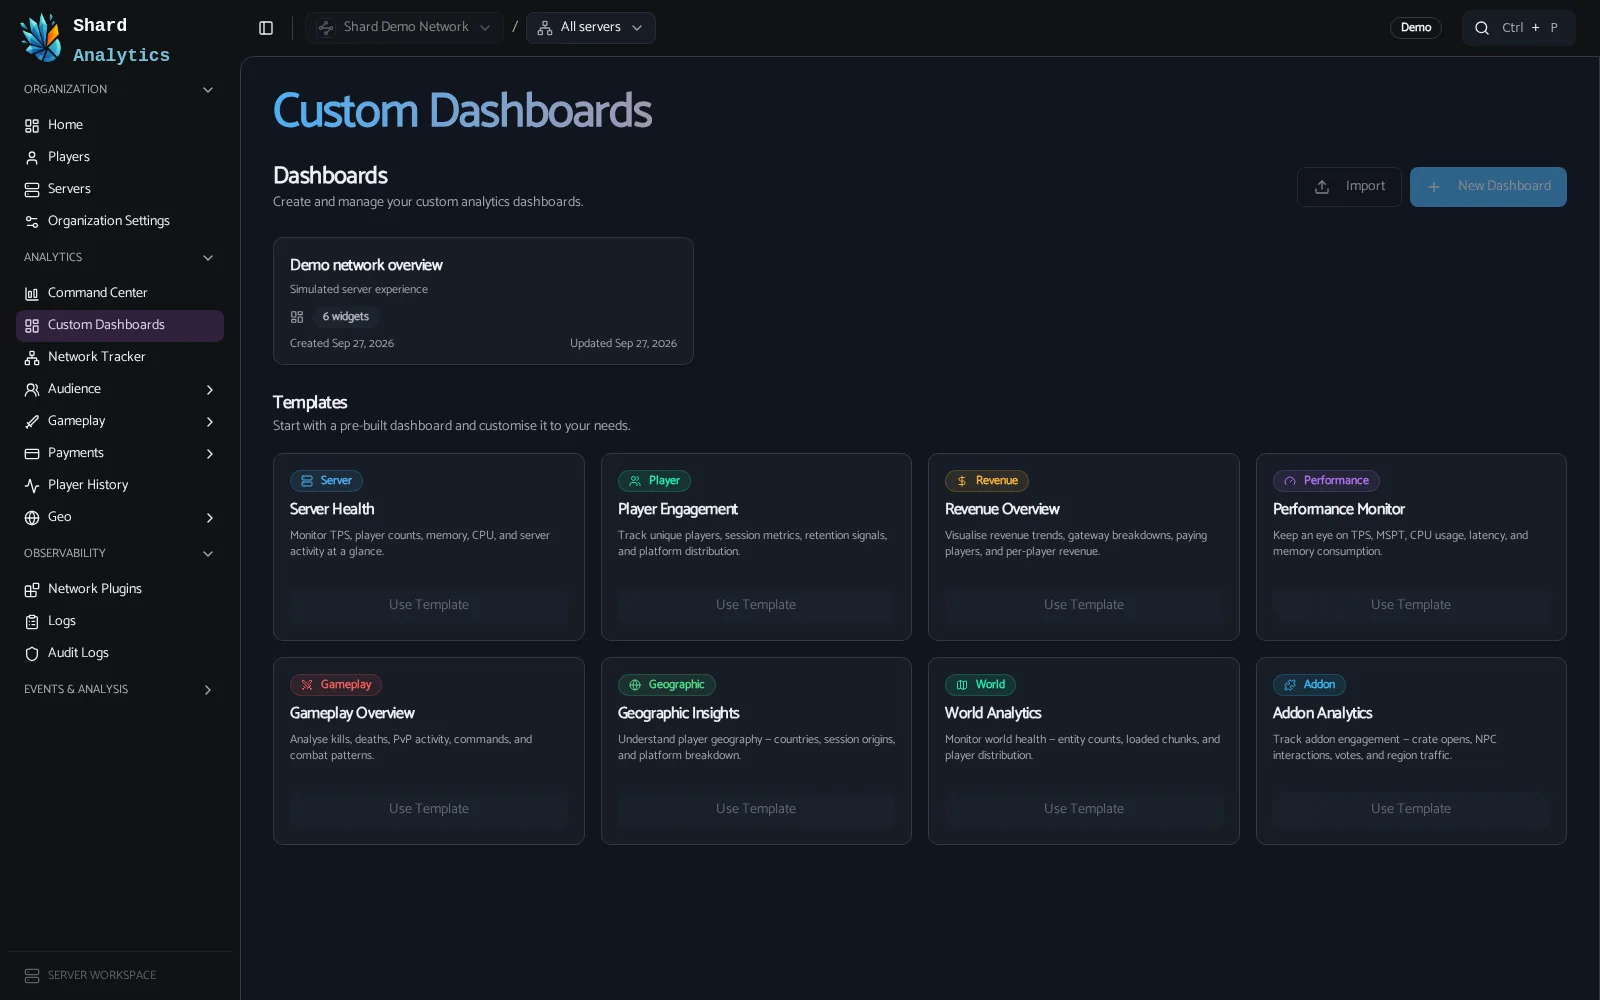
Your Command Center
Everything you need to manage, analyze, and optimize your Minecraft network in one powerful dashboard.
Instance "Skyblock-02" crashed or went offline.
Uptime restored on instance "Survival-01".
TPS dropped below 18.5 (Current: 17.65).
Automatic Schema Discovery & Indexing
Send custom events from your plugins. ShardAnalytics indexes the payloads and makes them queryable in dashboards and funnels.
Live in three steps.
No SDK project, no data warehouse. Add the connector, set your key, and watch data arrive.
-
Create a server
Create your organization and add a server in the dashboard. Each server gets its own API key so identity and attribution stay correct.
-
Install the connector
Download the plugin from that server's Download page, drop the jar into your plugins folder, and restart. Paper servers supported.
-
Connect and verify
Set the key from the console and confirm collection. Heartbeats, metrics, and players appear in the dashboard within minutes.
# 1. Save your server API key
/shardanalytics setapikey <your-api-key> confirm

# 2. Confirm the connector is authenticated
/shardanalytics statsScroll through how teams use ShardAnalytics.
A pinned walkthrough: audience intelligence → revenue → campaigns.
Audience Intelligence
Popular Packages Revenue Share
Last 30 daysCampaign Attribution Performance
Domain & Code TrackingGroup by lifecycle and activity indexes, and monitor return probabilities.
Analyze gross/net revenue, gateway conversion, and decline insights.
Attribute acquisitions to first-join domains and creator codes.
Know who your players are.
Don't just count players—understand them. ShardAnalytics categorizes your playerbase based on onboarding lifecycle and ongoing activity patterns.
- Lifecycle StagesTrack onboarding success by categorizing player sessions into New and Returning cohorts.
- Activity IndexMap player engagement across five standardized groups: Inactive, Irregular, Regular, Active, and Very Active.
- Return ProbabilitiesForecast retention cohorts with statistical bounds to flag players at risk of churning.
Turn players into supporters.
Analyze checkout trends, purchase conversions, and actual take-home revenue after platform gateway fees.
- Net Revenue InsightsVerify your platform net profit against gross sales automatically using gateway rate templates.
- Conversion FunnelsIdentify checkout conversion rates and inspect payments overview analytics without setup friction.
Measure what actually drives growth.
Track campaigns via player join domains and creator codes. Measure precise conversion rates and marketing ROI.
- Join-Domain AttributionAttribute acquisitions based on the first subdomain a user connects with or custom creator codes.
- ROI & Conversion MetricsShowcase campaign costs alongside actual player revenue to calculate exact channel ROI.
Free during the beta.
Every feature is included while ShardAnalytics is in open beta. Subscription plans will be announced after the beta, and teams that join now keep free access while it runs.
- Full platform access during the beta
- Custom dashboards and real-time alerts
- Player, retention, and gameplay analytics
- Payments and campaign analytics
- Discord support
No credit card required. See full pricing
Questions worth asking first.
Do I need to install a plugin?
For Minecraft, yes. A lightweight plugin for Paper servers sends sessions, events, and server telemetry. Store data arrives separately over a webhook, so you can connect revenue before touching the game.
Do I need a store connected?
No. Players, sessions, retention, and gameplay analytics work from the plugin alone. Revenue, packages, declines, and chargebacks appear once Tebex or a custom webhook is connected.
Can I try it without an account?
Yes. The live demo runs on generated sample data and covers the Command Center, Players, Payments, Dashboards, Alerts, Logs, and the Network Tracker. No signup required. Open the live demo →
Is it really free?
ShardAnalytics is free during the open beta. Every feature is included, there is no credit card required, and subscription plans will be announced after the beta. Teams that join now keep free access while the beta runs.
How long does setup take?
Usually a few minutes: create a server, install the connector, set the key, and confirm data. There is no SDK project or data warehouse to build first.
Who can see my data?
Access is scoped to your organization and controlled by roles. Owners and admins manage settings, members see the views you allow, and the audit log records configuration and membership changes.